

2024 sets some new road safety records
by Matt Lowrie

Last year, 292 people died unnecessarily on our roads. That is the lowest result in over a decade and only the fourth time in the last 70 years we've seen fewer than 300 deaths in a calendar year. Yet, while it is 292 people too many, with each death being a tragedy for the family and friends of those lost, it is also arguably the best year New Zealand has yet seen.
The last time we saw fewer than 300 deaths in a calendar year was in 2014 with 293 deaths and the lowest ever was a year earlier with 2013 seeing 253 people die on our roads.
That's a far cry from the mid-80's when nearly 800 people died on our roads. Between then and 2013, with a small amount of annual variation, there was consistent downward trajectory for road deaths as vehicles, roads and education, enforcement improved. But from 2014 onwards deaths increased again for a sustained period. Even months of COVID lockdowns weren't enough to bring deaths back below 300.

After a bad January, for much of the year we were on track to get close to that 2013 record with monthly results at or below those 2013 levels but a stark rise in the last few months put paid to that. Notably, in October was when the government announced they were going to impose blanket speed limits on the country (while claiming the opposite).

Adjusting for population and travel
Of course, there is one big difference between the numbers in previous years and now and that is population. In 1987 when there were almost 800 deaths on our roads the country had a population of 3.3 million, two million fewer than we have now. Even between 2013 and now our population has increased by over 900,000 people. The number of deaths per 100,000 people is a common metric used internationally to compare the road safety performance of different areas and on that basis that this was arguably our best ever year.
Our population increase means that last year saw 5.5 deaths per 100,000 people, slightly below the 5.7 of 2013 and well below the 23.8 of 1987.
However, it is worth remembering that this is still much higher than many of the countries we like to compare ourselves to. Australia is around 4.5 per 100,000 people and parts of Europe are even lower. Norway, with a population only slightly higher than New Zealand and with a more difficult geography and climate had just 90 deaths last year which is just 1.6 per 100,000 people. Many other countries in Europe are in the 2-4 range.
There have also been some suggestions that last year's low result is just because of the economy but these claims don't stack up. Despite the current government induced recession we're in now, vehicle km travelled are the highest they've ever been with over 49.2 billion km travelled in the 12-months to the end of September with trucks making up over 818 million km of that. By comparison, in 2013 the vehicle fleet travelled just under 40.3 billion km with trucks making up almost 637 million km. Likewise the 2013 result was after the country had largely recovered from the Global Financial Crisis.
Road deaths measured per 1 billion km travelled is another common metric and on that 2024 is sitting at around 5.8 and again this is the lowest it's been with 2013 sitting at 6.3 deaths. Australia is at around 4.9 under this metric and Norway about 2.
Both the per capita and per km travelled metrics are shown below and as you can see, follow a very similar path. Also in both cases the data is only up until September but the trend is clear.

Who is it that dies on our roads.
These charts are based on some quick breakdowns by the Ministry of Transport and show where the change in the last few years has come from.
By Mode
As you can see below, deaths in 2024 were down for most modes of road user.

The 2024 numbers are yet to be finalised but so far it looks like last year will be the lowest, at least in the last 40 years, for pedestrian deaths. Perhaps those raised tables are actually working?

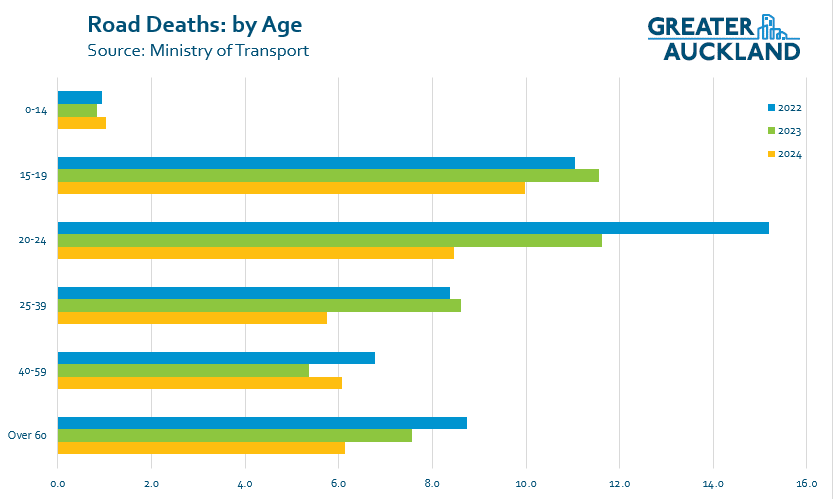
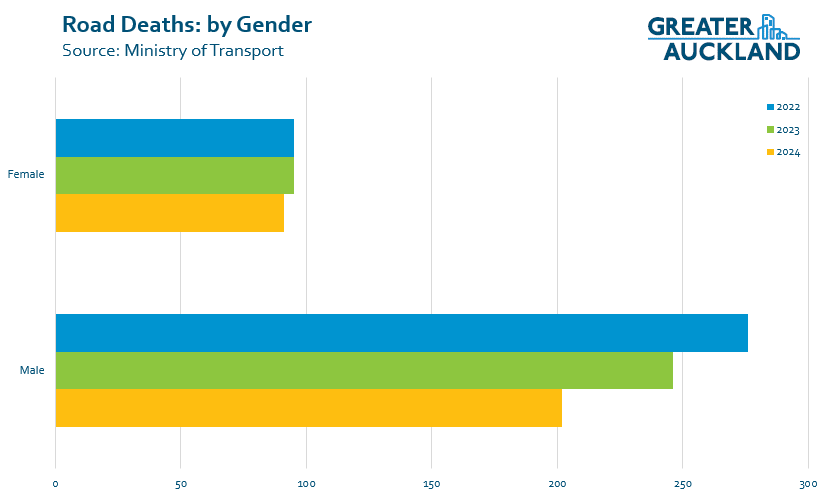
By Age and Gender
Road deaths by age uses inconsistent age banding which does distort the picture somewhat however on a per capita basis young drivers (15-24) have the most deaths per 100,000 people than the other age groups.
Despite coming down significantly in the last few years, Almost twice as many men die on our roads compared to women.
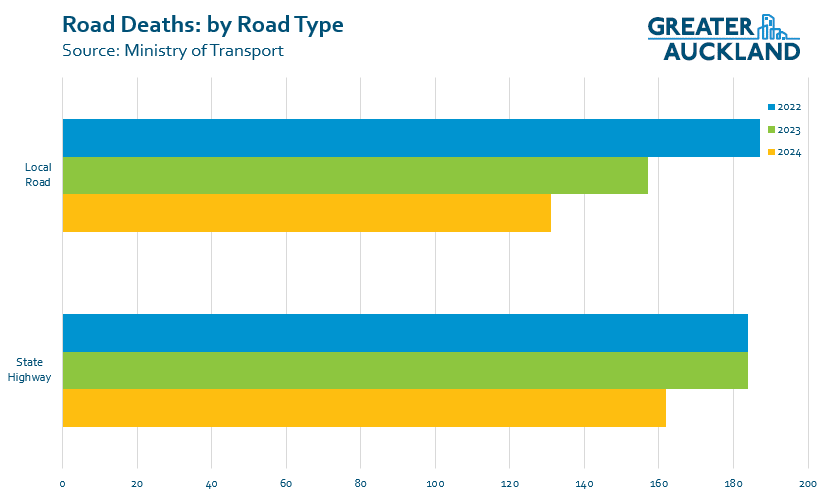
By Road Type
We can see that deaths decreased more on local roads than state highways over the last few years.
Auckland
Finally, there were 36 deaths on Auckland's roads in 2024. That's down from 47 in 2023 but not the lowest we've ever seen.

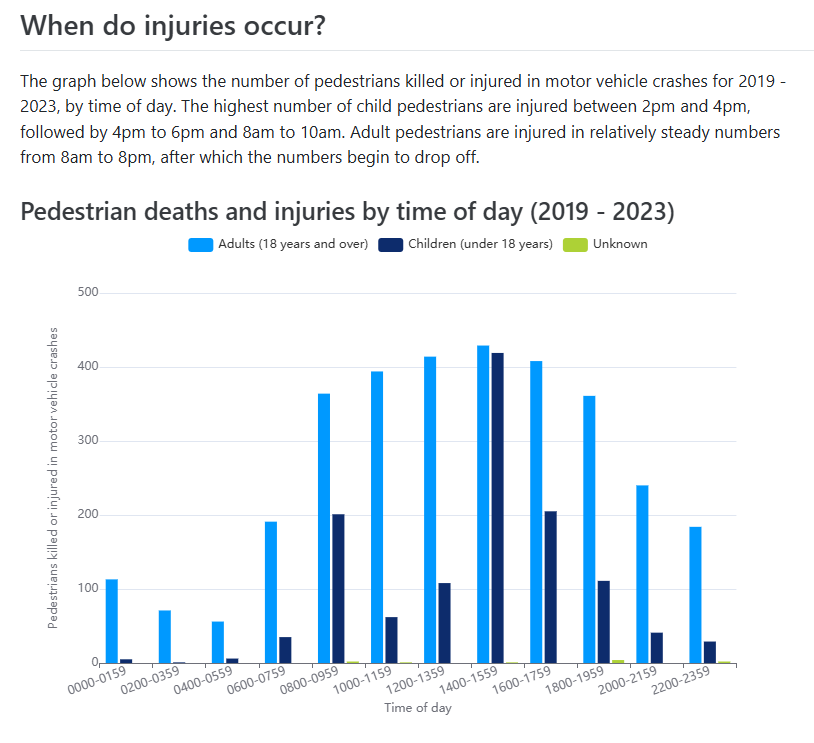
Post-script: these two MoT charts I came across while preparing this post tell a grim story about pedestrian deaths, regarding who's most likely to be injured by a vehicle, and when: children and young people, on the way home from school.
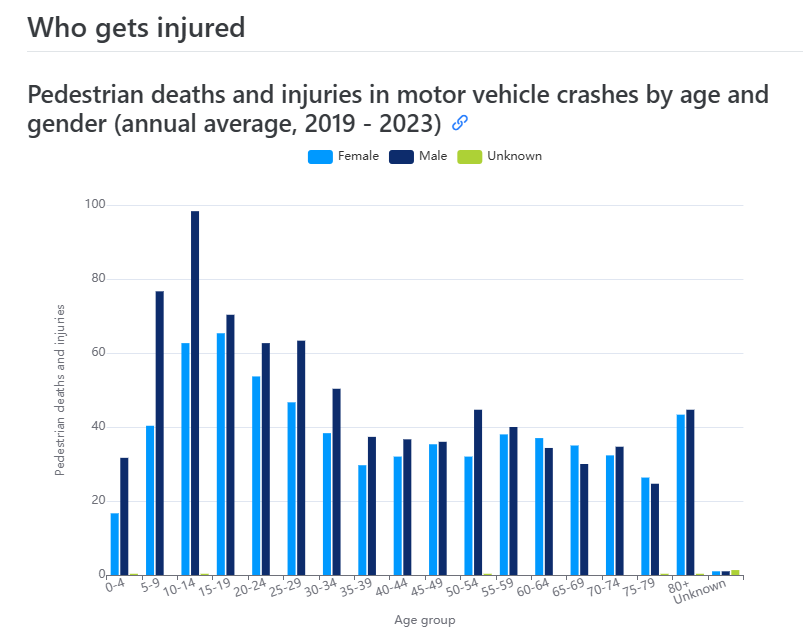
Very useful stats. Thank you