This guest post by Tim Adriaansen, an advocate for accessibility and sustainable transport, originally published on LinkedIn and cross posted here with permission.
People prefer cars, right? Probably not. Here's why.
Granted, most people in English-speaking countries use a car to get around. This simple reality underpins our transport modelling, planning and investment decisions. Unfortunately, when used in this way, we're succumbing to a type of bias which means that the numbers behind those transport models, plans and investments are complete nonsense.
Imagine you're working in an office, and the team leader decides to provide morning tea for everybody. They assign the task to one of your colleagues, who is given the title of "Snack Department".
The next day, Snack Department turns up at 10am carrying a tray loaded with cupcakes—enough for everybody. They walk around the office and allow each team member to grab one or more deliciously decorated treats. Some people decline: Perhaps they're counting calories, they're vegan or they avoid gluten. But all-in-all, 9 out of 10 people in the office grab a cupcake.
After delivering a cupcake to each workstation in the office, Snack Department asks everybody to lift their morning snack high in the air to take a photo.
They send out an email celebrating the success:
"Our office loves cupcakes!" they announce. "9 out of 10 people prefer cupcakes over other types of morning snack!"
Can you see the problem with this statistic?
When a cupcake is served up right in front of someone, they're very likely to take one.
Cupcakes are tasty and people enjoy them. But to know if people would choose something other than a cupcake, that alternative also needs to be on the serving tray. Without any other options available, and with the cupcakes placed right in front of them, someone's choice to consume cupcakes is a poor—and misleading—indicator of what economists call ‘revealed preference’.
Transport systems are a lot like serving trays. When people step outside of their home, what transport options are being served up?
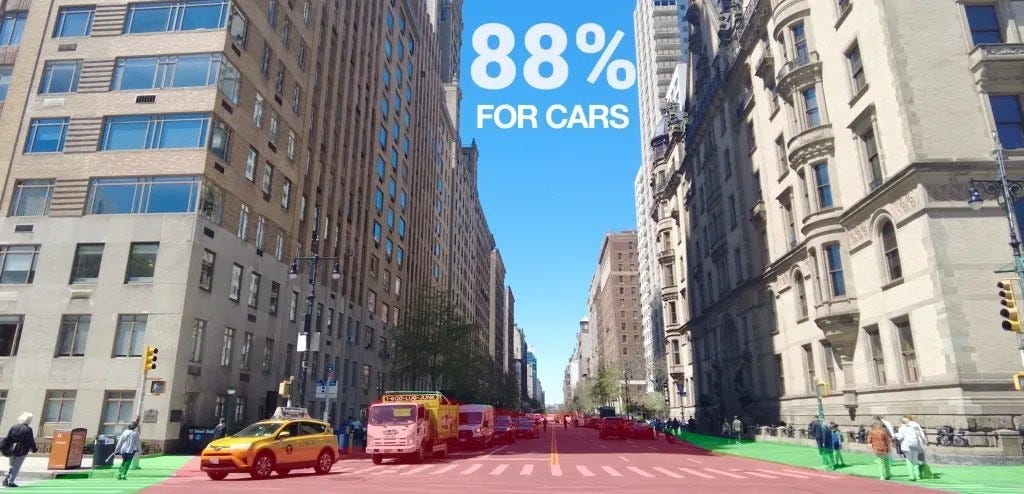
Since the 1950s, our transport systems have been designed to make it as easy as possible to drive. Using public money and public land, every aspect of the transport serving tray has been loaded with infrastructure designed to make driving the convenient (and sometimes only) choice.
Providing car parking alongside every new home, shop or office was mandatory for decades. Valuable street space has been made available for storing cars at the expense of any other purpose. Intersections were designed to squeeze through as much motor vehicle traffic as possible—often making them too wide to easily walk across, or too busy to safely cycle through.
By comparison, not nearly as much public transport or bicycle infrastructure has been provided. Few people live within walking distance of fast and frequent bus or rail services. Even fewer live somewhere with a connection to a safe cycling network. For most people, these options aren't on the tray.

Thinking that people have transport ‘choice’ is like Snack Department handing out cupcakes at people's desks while telling them “there are also apple slices and carrot sticks available, if you walk downstairs three floors to the cafeteria and purchase them for $5”.
Could we reliably use this offering to decide if people preferred to snack on apple slices over cupcakes?
Our transport system makes cupcakes convenient, while getting your hands on fruit and vegetables requires extra effort. Given what people are being served, it's absolutely predictable that cupcakes will be much more popular.
This situation is known as the "illusion of choice", a cognitive bias where people are led to believe that they have more options than they actually do. In other words, people feel like they're being given a choice between different things, when in actuality their behaviour has been pre-determined by the way those things are presented.
This bias is routinely exploited by manufacturers and marketers of all sorts of products, and in the case of transport, it is used to reinforce “motonormativity”—the idea that cars are the normal, or default, way for people to move around.
As with most cognitive biases, this one can be tough to shake. Almost every discussion about transport systems will involve somebody saying there is a “preference for driving”, when in fact this “preference” is an illusion. Whenever somebody claims that “people love cars!” when talking about the transport patterns of their city or country, they are inadvertently giving away that they have succumbed to the “illusion of choice” bias.
In a transport system that overwhelmingly serves up driving, it's bad thinking to reach the conclusion that people prefer driving.
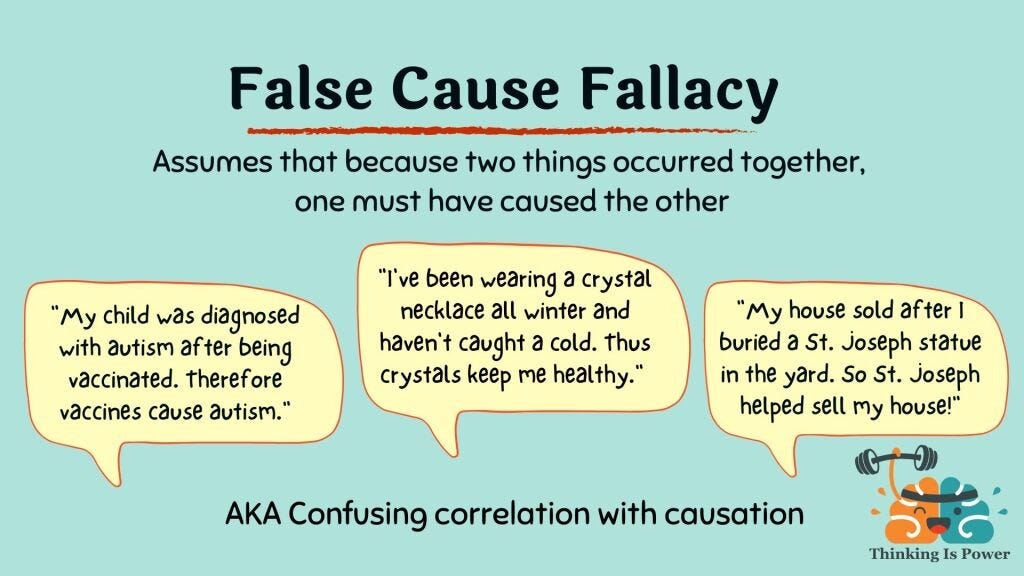
This bad thinking is known as a “causal fallacy”: Incorrectly assuming that one thing results from the observation of another. In this instance, somebody may believe that “people prefer driving”, because that is what they see when they look at how people move around their community. This perception is consistently reinforced by car industry marketing, which associates car use with fun, freedom and even strength or masculinity. In reality, people prefer the mode of transport that has been made easiest, and most transport resources have been ploughed into making it easy to drive.

Unfortunately, this fallacy frequently shows up in transport modelling. A transport agency will (historically) serve up widespread driving infrastructure, take a snapshot of people with their cars, and say “90% of our residents choose driving! We need to accommodate this level of driving as our population grows!”
This erroneous thinking—where the model is baselined against a serving tray offering little other than driving—will always produce misleading results. Transport models built on user data from car-centric systems suffer from in-built biases, illogical assumptions and false thinking, and should not be relied upon to estimate the impacts of transport system changes.
This applies when, for example, investment is being considered into cycling or public transport networks. Current rates of cycling on unsafe or incomplete networks, or bus patronage on infrequent routes, cannot provide useful information on how many people may want to use these options if they were to be made available on the same ‘serving tray’ as driving. If it is currently easy to drive but does not feel safe to cycle, the ‘choice’ being provided is an illusion, not a useful piece of data.
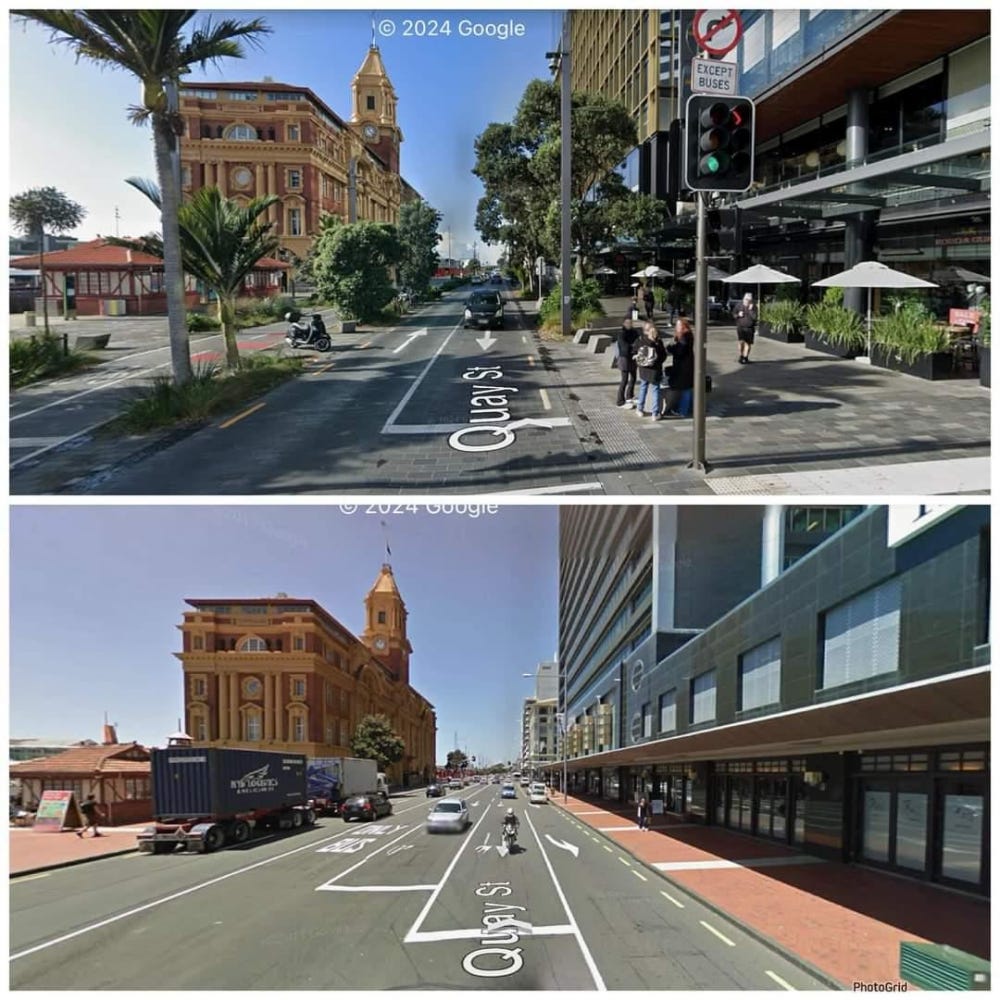
We also see this fallacy at work when we consider repurposing on-street parking, for example to install bus-priority lanes. Where on-street car parking (car priority) exists but a bus lane (public transport priority) does not, cars are on the serving tray but catching the bus is ‘three flights down in the cafeteria’. Counting the number of people currently choosing to drive (and park) is misleading, and will not give us useful data about how people will behave when we change what is being served up.
Critically, the “illusion of choice” bias and associated causation fallacy often rears its head when cities are planning how to reduce transport emissions. If false thinking is used to assess the potential for behaviour change, targets may seem unachievable and costly. When planners and decision makers understand how current patterns are a result of what is being served on the tray, and how that offering can be changed by using street space differently, they can more confidently embrace plans to shift car trips to low-pollution modes like walking, cycling or shared transport.

When the Snack Department serves people nothing but cupcakes, then goes on to conclude that most people prefer cupcakes over other snacks, we can see the illusion of choice and associated logical fallacy.
To avoid succumbing to the same problem, transport professionals must measure and evaluate what is being served, rather than focus on what is being consumed.
How easy is it to access different networks (including driving, shared transport and active transport)? How complete are these networks—what can be accessed with each mode? How can we quantify currently observed behaviour based on the availability and quality of these different networks?
Importantly, transport professionals need to be careful that we don't fall into the “illusion of choice” cognitive trap, and suggest that existing levels of car use are indicative of revealed preference.


I get the cupcake analogy. It’s also the power behind the network effect, where the more people who join one network (mode of transport, type of snack etc) the more advantaged that option becomes. It’s a snowball rolling down a hill.
I also know though that Auckland is spread out. The destinations I want to get to are all over the show. Yes, that is partly the result of cars. Without them we would no doubt live in a more compact space, better served by the transport options of New York, Paris and London.
But I think that bird has flown. At the margins we can improve bus lanes, bike lanes, walking, scooters and so on. But I don’t see myself picking up my groceries from Mangere Pak’nSave by bus anytime soon. I live in Mangere Bridge. I don’t think there is any conceivable way that public transport is going to do this for me.