The current government might be inexplicably hostile to cycling as a transport mode, and COVID might have changed the nature of work and thus commuting, especially in places like the city centre. But that's not stopping people getting on their bike – especially as most trips aren't even work trips. The positive signs starting to come through in the data.
To keep track of trips made by bike (and, increasingly, scooter), Auckland Transport relies mainly on automatic counters, and is using more and more of them. From just eight counters around 15 years ago, AT now has 81 counters spread out all over the Auckland region. More are being added and all the time: one of the most recently added counters is on the fantastic upgrade of Meola Rd (more on that later in the post).
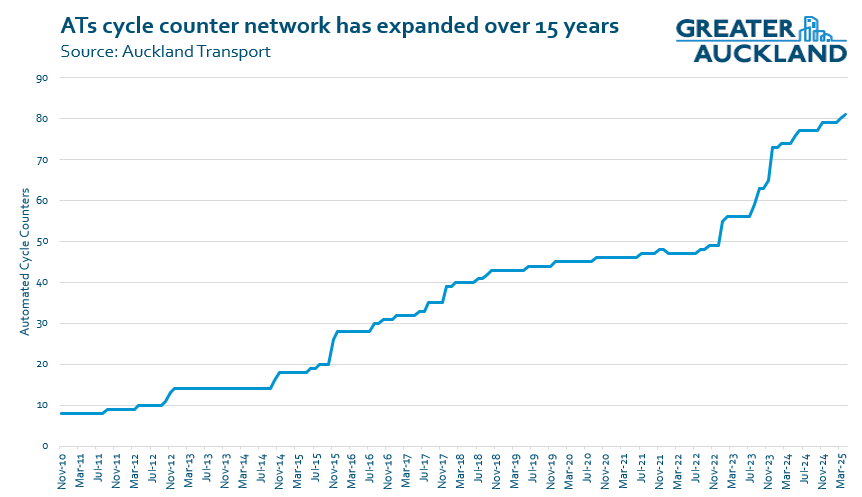
Collectively, these counters typically record over 20,000 bike movements each workday, and around half a million trips by bike each month. That's a lot of people moving around. Note:
Of course, some bike trips will be picked up on more than one counter; this is normal, and is exactly the same for other kinds of traffic counts, like vehicles and pedestrians. A bike is one less car at every point along the way, and the decongestion effect is worth measuring. It's also proof of the network effect, if more trips are attracted to – and recorded on – more routes.
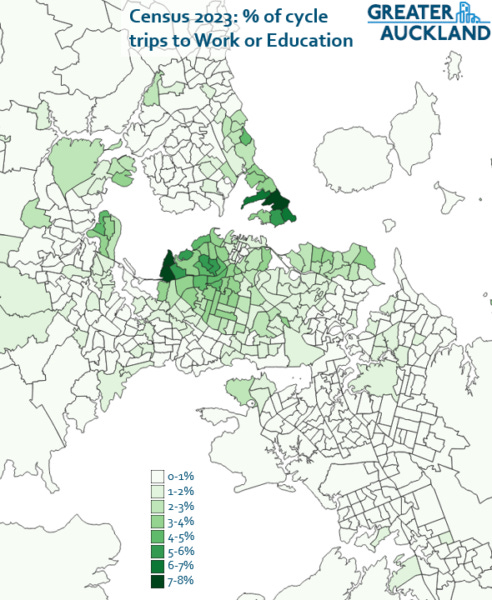
Also of course, despite the growing coverage, many – perhaps even most – trips will never be recorded. Almost all journeys to school by bike, most shopping trips by bike, and many trips to work by bike just aren't counted by AT's current methods. For that, we can look to observational counts, and of course the Census, which reveals important islands of high active mode use.
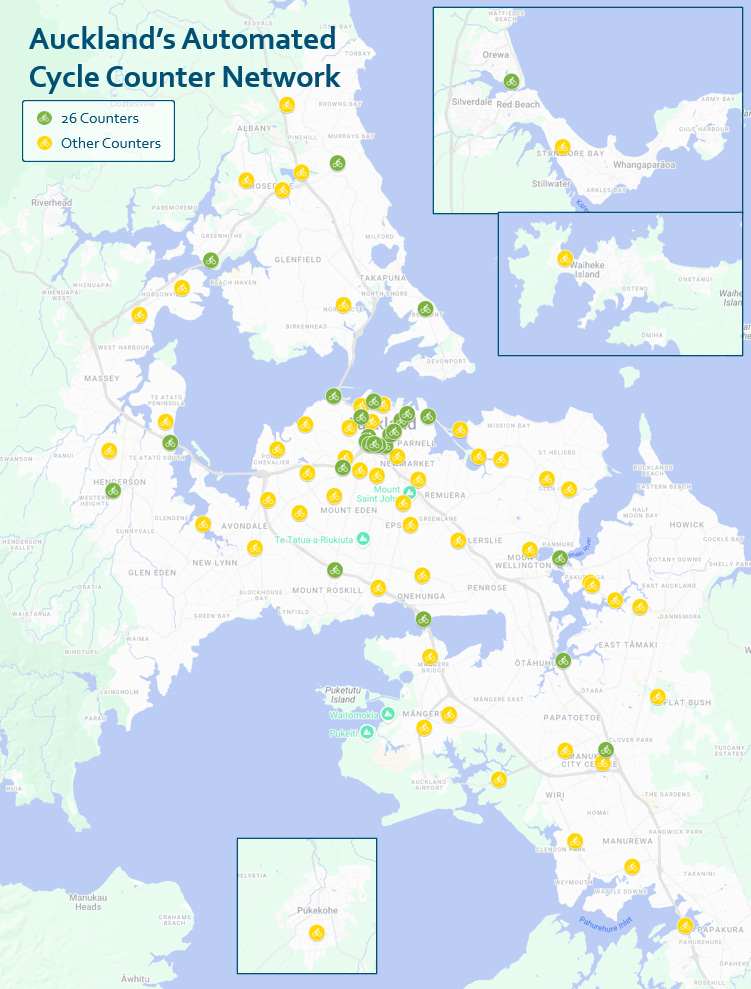
Getting back to the automatic counters: when it comes to Auckland Transport's official performance metrics, AT relies on the results of just 26 of their 81 counters. Why just 26? Because they're the oldest – all but two of them were installed by the time Lightpath opened in December 2015 – and this provides now a near-decade long data series to compare changes.
The most recent data available is from April. As we saw with public transport, numbers in April were a bit lower than April last year due to half the month being taken up by Easter holidays and Anzac Day, combined with two weeks of school holidays.
The trend on the 26 counters
In the 12 months to the end of April, the 26 baseline counters recorded 3.44 million bike movements. That's up from 3.31 million in April 2023, and is right on the target set out in AT's Statement of Intent. So as long as the numbers in May and June follow the current trend, it's a metric AT will be able to say they've exceeded at.
As with other modes, counts are still generally down on what they were pre-COVID; this is the work-from-home effect. For these 26 counters, usage peaked in February 2020 just prior to the pandemic with 3.80 million trips, meaning the current numbers represent about 90% of that level. (March 2020 was on track to be the biggest month ever on the bike paths, but...)
Counters in the City Centre
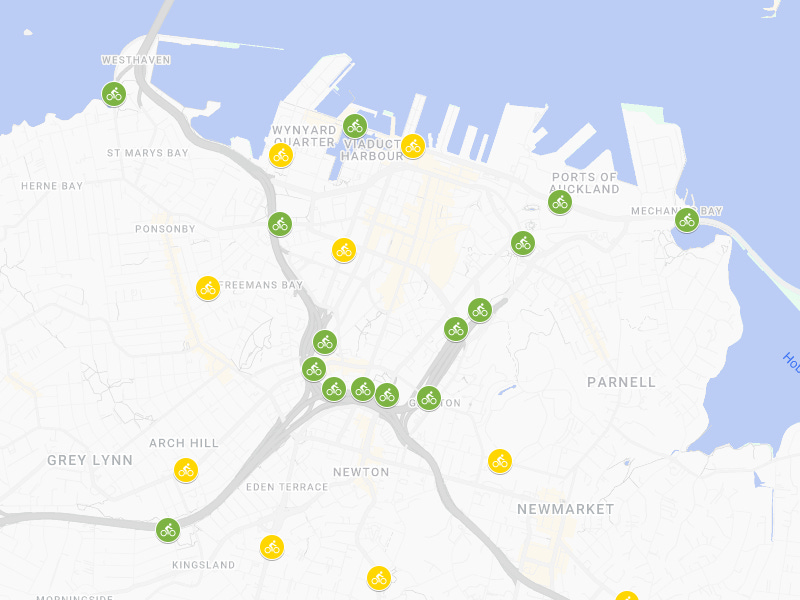
It can be hard to tell from the earlier map, but half of the original 26 counters are focused on the access points to city centre. This ties in with the boost in investments a decade ago, which improved bike access to the city centre via projects like Grafton Gully and Lightpath.
Interestingly, looking at the results from just these counters gives a different picture. As you can see below, bike trips to and from the central city are basically back where they were pre-COVID. This is especially notable because public transport and driving trips to the city centre have declined as work patterns have changed. That cycling is back to this level is positive, and may even represent a significant mode shift happening under everyone's noses.
Counters on the Northwestern Path
While the aggregated views above help give a wider picture, one of my favourite counters to look at is the one on the Northwestern cycleway at Kingsland – one of the busiest in the city, and a powerful indicator of the network effect.
The Northwestern cycleway is one of the city's flagship bike routes, and now the second most well-used after Quay St. But it wasn't always this way. The counter at Kingsland is one of the oldest in the region, having been installed when the cycleway was extended through Kingsland in 2010.
At that time, usage was just a fraction of the then-busiest route of Tamaki Drive. But as the Northwestern cycleway was steadily improved and extended through the 2010s and beyond, and as the wider network expanded, providing more and more connections (on-ramps and off-ramps, as it were), ridership soared.
It is a perfect example of the network effect in action, as visualised in this post from 2021. Actually, let's drop that 2021 animation in here once more, as it's too good not to revisit. The point is, as connections are built and added, ridership grows and more ridership is encouraged.
And now, looking at the most recent data: as you can see below, just as with the city centre more generally, ridership on the NW Cycleway through Kingsland is essentially back to what it was prior to 2020.
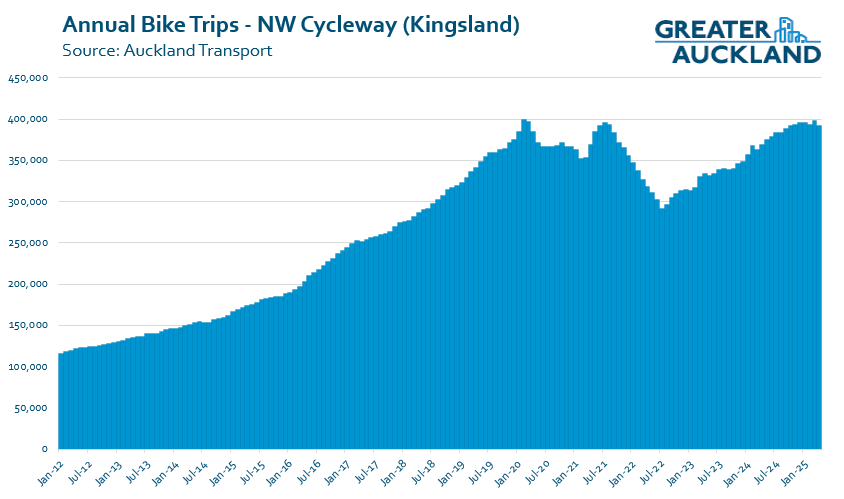
It's not weekend trips making up this growth, either. On the Northwestern, most trips happen during the working week – with Tuesdays and Thursdays now even higher than they were in the year prior to 2020.
The newest counter on the network: Meola Road
Finally, Meola Rd is one of the newest counters. It was installed after the amazing upgrade Meola and Pt Chevalier Rd recently received, which scored a lot of headlines – although now that the infrastructure is up and running, the headlines have mysteriously died away.
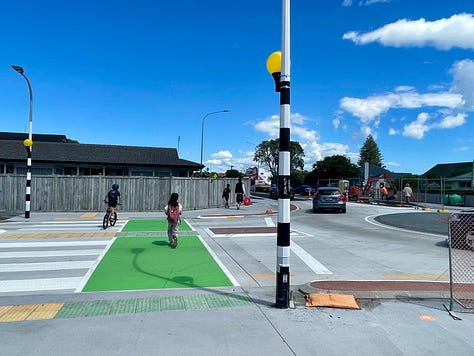
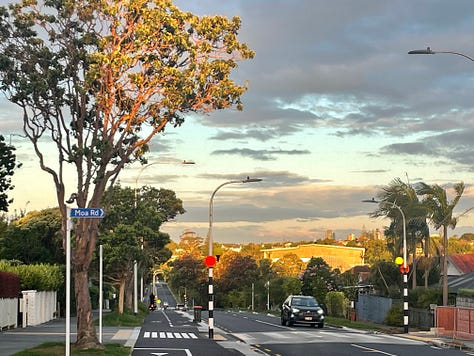
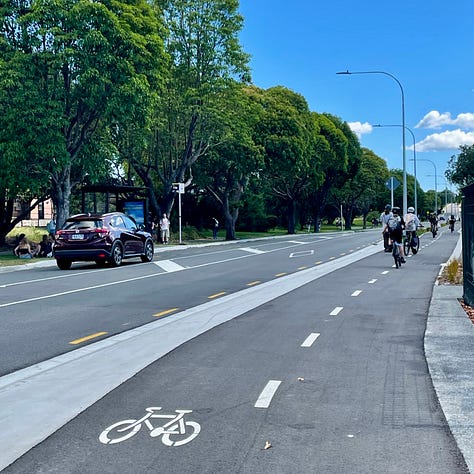
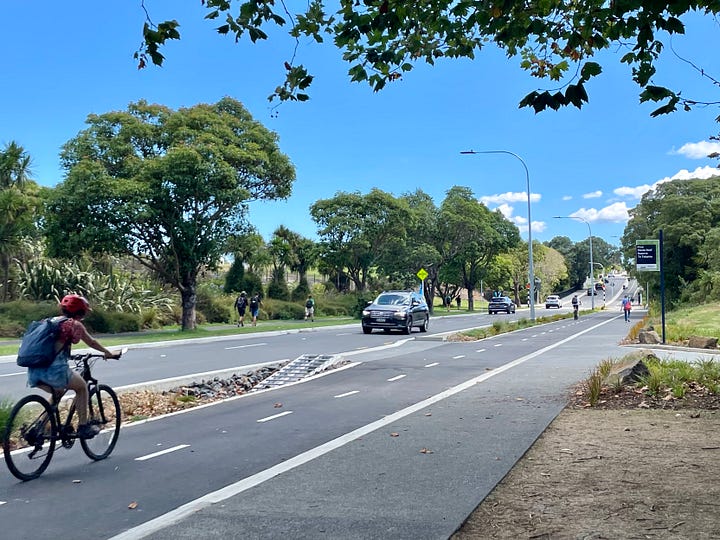
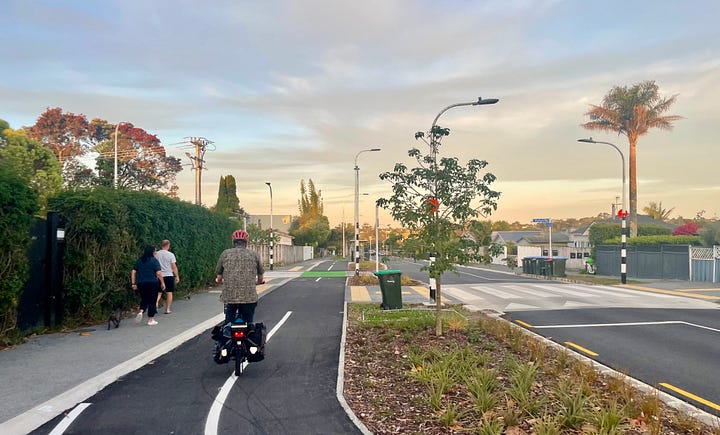
The project was only completed this year, and we only have data from March onwards – but the great news is that this is already one of the busiest routes in the region. It's a fantastic start, and ridership is only likely to grow over the coming years as more people give getting on a bike a go.
Further data breakdown from AT, as shared by Bike Pt Chev, notes that with an average 500 trips a day in March, Meola Road is already well on the way to meeting the business case target of 700/day in 2028. The mode share is also promising:
What about other kinds of people-powered/ public transport, you ask? These are the March numbers:
Bikes: 15,514
Scooters: 2729
Pedestrians: 19,927
Bus passengers (on AT buses): 29,204That's ~67,000 trips in March that didn't add an extra car to the road!
AT estimates that driving currently still accounts for around 80% of people-journeys on Meola Road (461,325 people-trips in March, based on a car occupancy rate of 1.51, so around 373,000 cars on the road).
They also expect - as do we – that people using the alternatives will continue to grow over time. Expanding the network of safe links towards the city will help with this. So will keeping our local 30km/h speeds on all the quiet residential streets that give everyone safe access to our swish new main routes.
Both of these are in AT's power to provide, but it's locals who can make the case for both by sharing our stories of how safe speeds and safe routes go together like bread and butter.
One more thing to know: the counters are in the middle of Meola Road, near MOTAT2. So they're not even catching the thousands of local walking, biking and scooting trips at each end – including the hundreds of kids who bike to Pt Chevalier Primary, Pasadena Intermediate, and Westmere School every day.
It really is all the more perplexing that AT appears hellbent on raising speeds on the local streets that feed into this especially high-profile new infrastructure, from a safe and amenable 30km/h, back to 50km/h. If this proceeds, the kids in the header image, currently using Meola Road, in huge numbers will be spat out back onto high-speed side streets, and logically back onto the footpaths or into cars – a negative network effect that will undermine the whole point of the investment.
Now would be a great time for AT to take a refresher on both the "network effect" and its alleged Safe Systems approach. Otherwise it risks negating one of its quieter successes of the last decade.
The steady growth of cycling as a mode across the city, despite the slow rollout of infrastructure and political headwinds, should be a headline that our transport agency could be proud of. And the people who get on their bikes - whether or not they ride over an automatic counter on their journey - deserve a whole lot better.


This is interesting but the missing thing of course is the cyclists who don't pass the counters. I commute by bike between Ponsonby & Mt Albert (not every weekday). I ride on road both ways but a decent part of that is on the Sandringham Rd bus lanes (against the rush hour). It's safe and fast and I see plenty of cyclists along this route. The true cycling commuter count is probably well understated
I am so grateful for the safe and excellent cycleway I take from Waterview to Auckland city hospital fir work .
The other day I cycled to Galway street down Queen st and back to Waterview via the cycle pathway along Silo ,under the Harbour bridge and thru the quiet Herne bay backstreets to Meola Rd and Pt Chev . Fantastic !! 👍